


Washington, DC Research Facts and Visitor Research
Destination DC (DDC) releases key tourism facts and figures annually. The following documents provide additional and historical information about the Washington, DC hospitality industry. Please note that our research is released annually.
To learn more about DDC research and reports, or to discuss what information may be relevant to your organization and its needs, please contact Sandra Whitehead, Senior Research Manager, at sandra@washington.org.
For additional statistics about DC, visit census.gov
Hotel Facts
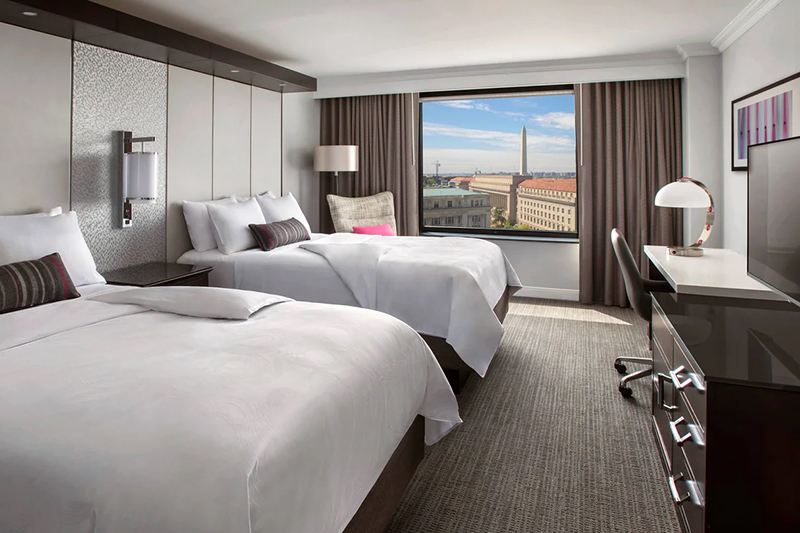
There are approximately 179 hotels with 36,187 hotel rooms located in Washington, DC. The Greater Washington Metropolitan Area is home to 798 hotels with 117,258 rooms (including those located within DC proper).
There are 7,792 committable rooms within half a mile of the Walter E. Washington Convention Center.
There are 22 properties with 3,220 rooms currently in the construction pipeline in Washington, DC that are expected to be delivered in 2026 and beyond, including four (4) that are currently under construction.
DC’s hotel occupancy and average daily rates reach their peaks in March through June and September through October.
Source: CoStar, May 2026

L'Annexe
Restaurant Facts
There are 2,661 restaurants located in Washington, DC.
26 restaurants in Washington, DC have earned Michelin stars.
28 restaurants in the city have received the honor of the Bib Gourmand designation.” Michelin’s 2025 update added two new Bib Gourmand restaurants and no new DC stars.
One of Conde Nast's ten best places to eat in the world, DC’s culinary distinctions include James Beard award-winning chefs, AAA Five Diamond ratings, RAMMY Awards (honors handed out by the Restaurant Association Metropolitan Washington for local dining excellence), restaurants included on Bon Appetit’s list of the “Best New Restaurants in America” and Bon Appetit's "Restaurant City of the Year" in 2016.
More than 70 DC restaurants offer private dining space, including a dozen within a few blocks of the convention center.
Sources: Michelin Guide, National Restaurant Association
Visitor Statistics
- 27.2 million total visitors came to Washington, DC in 2025, up 0.1% year over year.
- 25.1 million domestic visitors came to Washington, DC in 2025, up 0.4% from 2024.
- 2.1 million international visitors came to Washington, DC in 2025, down 4.0% from 2024.
- Visitors spent a record $11.9 billion in 2025, up 4.0% from 2024.
- Visitor spending supported 114,013 jobs in Washington, DC in 2025, up 2.3% from 2024.
- Visitor spending generated $2.4 billion in tax revenue in 2025, up 4.4% from 2024.
Sources: MMGY Travel Intelligence, S&P Global Market Intelligence, Tourism Economics, U.S. Department of Commerce.
For more visitor statistics, please visit our Visitor Research page.

Georgetown Waterfront Park
Attractions
Top attractions include (with visitation numbers from 2024)
FDR Memorial 2.8 million visitors)
Korean War Veterans Memorial (4.0 million visitors)
Lincoln Memorial (7.7 million visitors)
Martin Luther King, Jr. Memorial (0.6 million visitors)
National Air & Space Museum (1.9 million visitors)
National Museum of African American History & Culture (1.4 million visitors)
National Museum of American History (1.8 million visitors)
National Museum of Natural History (3.3 million visitors)
National Zoological Park (1.9 million visitors)
Rock Creek Park (1.9 million visitors)
Thomas Jefferson Memorial (2.6 million visitors)
Vietnam Veterans Memorial (4.8 million visitors)
World War II Memorial (4.0 million visitors)
DC is also home to four major sporting event venues with 185,000 total seats and nine major professional teams including the Wizards, Mystics, Nationals, D.C. United, Capitals, Commanders, DC Defenders, Washington Spirit and DC Breeze.
There are 52 performing arts/theatre venues with more than 27,000 total seats.
*Sources: National Park Service; Smithsonian Institution; Theatre Washington
Washington, DC Demographic Information
- Population: 702,250
- 47% male and 53% female
- Greater Washington has one of the most highly educated workforces in the U.S. 64% of Washington, DC residents hold a Bachelor’s Degree or higher (compared to 34% of U.S. population).
- DC’s population is 43% Black (compared to 14% of U.S. population) and 12% Hispanic/Latino (compared to 20% of U.S. population).
- 18% of the Washington, DC population is under the age of 18.
- Median household income: $109,870
Sources: U.S. Census Bureau, 2025
Major Meeting & Convention Facilities in Washington, DC
Walter E. Washington Convention Center
- 703,000 square feet of prime exhibit space (five exhibit halls on two levels)
- 198,000 square feet of meeting room space
- 77 meeting rooms
- 52,000 square foot ballroom
- 38,000 square feet of flexible registration space
DC Armory National Guard Building
- 70,000 square feet of exhibit space
- 10,000 seat capacity for sports and theater events
Ronald Reagan Building and International Trade Center
- 65,000 square feet of exhibit space
- 22 meeting rooms
- 1,070 guest rooms and 20 suites
- 116,000 square feet of event space
Marriott Marquis Washington, DC
- 1,126 guest rooms and 49 suites
- 105,000 square feet of event space
- 783 guest rooms and 51 suites
- 101,000 square feet of event space
Renaissance Washington, DC Downtown Hotel
- 807 guest rooms and 13 suites
- 66,000 square feet of event space
The Mayflower Hotel, Autograph Collection
- 581 guest rooms and 69 suites
- 43,000 square feet of event space
- 871 guest rooms and 26 suites
- 42,000 square feet of event space
Hyatt Regency Washington on Capitol Hill
- 838 guest rooms and 31 suites
- 38,000 square feet of event space
- 263 guest rooms and 35 suites
- 38,000 square feet of event space
Transportation
Airports
Ronald Reagan Washington National Airport (DCA), Washington Dulles International Airport (IAD) and Baltimore/Washington International Thurgood Marshall Airport (BWI) served more than 87 million passengers combined in 2025.
Train
Washington, DC is accessible via three major airports and Amtrak service through Union Station.
Public Transportation
Metrorail & Metrobus
WMATA Metrorail and Metrobus provided more than 300 million combined trips in 2025.
For hours, fares and station information, visit wmata.com.
Rideshare
- Washington, DC offers a variety of transportation options including taxis, rideshare services, Metrorail, Metrobus, scooters and bike-share programs.
- The DC taxi cab network operates on a metered fare system regulated by the DC Department of For-Hire Vehicles.
- Uber and Lyft provide service throughout the Washington, DC metropolitan area, with options ranging from shared rides to luxury SUVs.
- Capital Bikeshare operates thousands of bicycles and e-bikes across hundreds of stations throughout the region.
Green Initiatives
- The District is committed to achieving carbon neutrality and climate resilience by 2045 through the Sustainable DC 2.0 and Clean Energy DC initiatives.
- Approximately 90% of parkland within Washington, DC is managed by the National Park Service.
- The Greater Washington metropolitan area includes more than 250,000 acres of parkland.
- In 2025, Washington, DC continued to rank among the top park systems in the nation in the Trust for Public Land’s ParkScore index, which evaluates park access, acreage, amenities and investment.
- DC’s Walter E. Washington Convention Center is LEED Platinum certified.
- For more information, click here to learn about the green experience in DC.
Sources: National Park Service, Trust for Public Land
International DC
- 19% of DC residents speak a language other than English at home.
- 14% of DC residents are foreign-born.
- Washington, DC is home to more than 175 embassies, ambassadors’ residences, international cultural centers and international organizations.
*US Census Bureau, 2024
Sales Tax
- DC sales tax: 6%
- DC hotel tax: 15.95%
- DC restaurant tax: 10%
- Maryland sales tax: 6%. Hotel taxes vary by jurisdiction, with most counties averaging between 5% and 8%.
- Virginia sales tax: 5.3% statewide minimum, with additional local taxes in some jurisdictions. Hotel taxes vary by jurisdiction, with most localities averaging between 9% and 11%.
Climate
DC has a generally temperate climate, with pleasant springs and autumns, and mild winters with approximately 14.3 inches of seasonal snowfall.
Month: Average Low (Fahrenheit) | Average High (Fahrenheit)
- January: 25 | 44
- February: 27 | 47
- March: 35 | 56
- April: 44 | 67
- May: 54 | 76
- June: 63 | 85
- July: 68 | 89
- August: 66 | 87
- September: 59 | 81
- October: 46 | 69
- November: 37 | 59
- December: 30 | 48
Washington, DC College/Universities Information
- Marymount University
- Montgomery College
- Northern Virginia Community College
- Prince George’s Community College
- Strayer University
- The Catholic University of America
- The George Washington University
- Trinity Washington University
- University of Maryland, College Park
- University of Maryland, Global Campus
- University of Phoenix
- University of the District of Columbia
Largest Hospitals in Washington, DC
(with number of total beds)
- MedStar Washington Hospital Center (749 beds)
- MedStar Georgetown University Hospital (453 beds)
- The George Washington University Hospital (385 beds)
- Children’s National Hospital (323 beds)
- Saint Elizabeths Hospital (292 beds)
- Sibley Memorial Hospital (318 beds)
- Howard University Hospital (228 beds)
- BridgePoint Hospital Capitol Hill (207 beds)
Source: American Hospital Directory, 2025